DPIRD drought forecast
DPIRD’s drought forecast shows that the area of NSW in the NSW CDI’s Recovery and Non-Drought categories is likely to increase over the August-October forecast period.
- DPIRD’s drought forecast uses the Bureau of Meteorology (BoM) seasonal climate model ensemble to determine the NSW-CDI for the coming forecast period. The figure shows the most likely (mode) outcome at the end of this forecast period (October 2024) of the 99 forecasts that are available.
- For most of NSW, Non-Drought and Recovery are the most likely drought category forecast, with moderate to high agreement (50-75%) across the model ensemble.
- Parts of NSW that are currently in the Drought Affected category are likely to transition into the Recovery or Non-Drought categories during the forecast period.
- The exception to this is the east and parts of the west of the Riverina and Murray LLS regions, which are currently experiencing drought conditions. These areas are likely to
wremain in the Drought Affected category. - The historical accuracy of the drought forecast ranges from moderate (40-60%) to very high (80-100%) over the forecast period depending on region.
- More information, including more detailed drought forecasts for 1 month and 2 months ahead, are available in section x. Guidance on appropriate application of climate forecasts and an overview of the DPIRD drought forecast is available on the DPIRD website.
The NSW DPIRD produces and publicly releases this drought forecast for the benefit of the NSW public. DPIRD encourages users of the forecast to use due care in the application of the information to all decisions. The user assumes all risk of injury or harm as a result of forecast use and agrees to assume all liability, claims, demands, damages, costs, expenses, and causes of action due to their decision to use the forecast.

Drought forecast
Overview of the DPIRD drought forecast
Seasonal drought forecasts are now available in the NSW State Seasonal Update. The seasonal drought forecasts have been developed as a drought early warning system to prepare for drought events, mitigate drought impacts, and better aid farm management decisions.
The DPIRD drought forecast has been generated by forcing the NSW DPI Enhanced Drought Information System (EDIS) [hyperlink] with calibrated forecast variables from the Bureau’s seasonal prediction system, ACCESS-S [hyperlink] to produce an ensemble of drought indicators. A 99-member lagged ensemble is used to determine the drought forecast.
The drought forecast framework has three primary components:
- Input: Forecast data from ACCESS-S2
- Processing: Drought modelling framework (AgriMod and EDIS)
- Output: Aggregated maps and data for reporting purposes
More technical details and formulas used to produce the DPIRD drought forecast will be released soon.
Understanding the DPIRD drought forecast figures
Most Likely CDI Category
The DPIRD drought forecast for NSW presents the ‘Most Likely’ Combined Drought Indicator (CDI) category for the forecast period. The Most Likely CDI category is determined by identifying the 'mode' of the CDI. The mode is the category that appears most frequently across all possible forecast outcomes in the ensemble run. It is the most common prediction for drought conditions in the forecast period based on the model's simulations.
This map can be used alongside the most current CDI map to observe current conditions and the most likely conditions in three months’ time.
Ensemble Agreement
Ensemble agreement refers to the level of consensus among the ensemble members. When there is high agreement, it means that most of models are predicting a similar CDI category, suggesting greater confidence in the forecast. If the agreement is low, it suggests that there is a wide range of possible outcomes, leading to greater uncertainty in the forecast.
Past Accuracy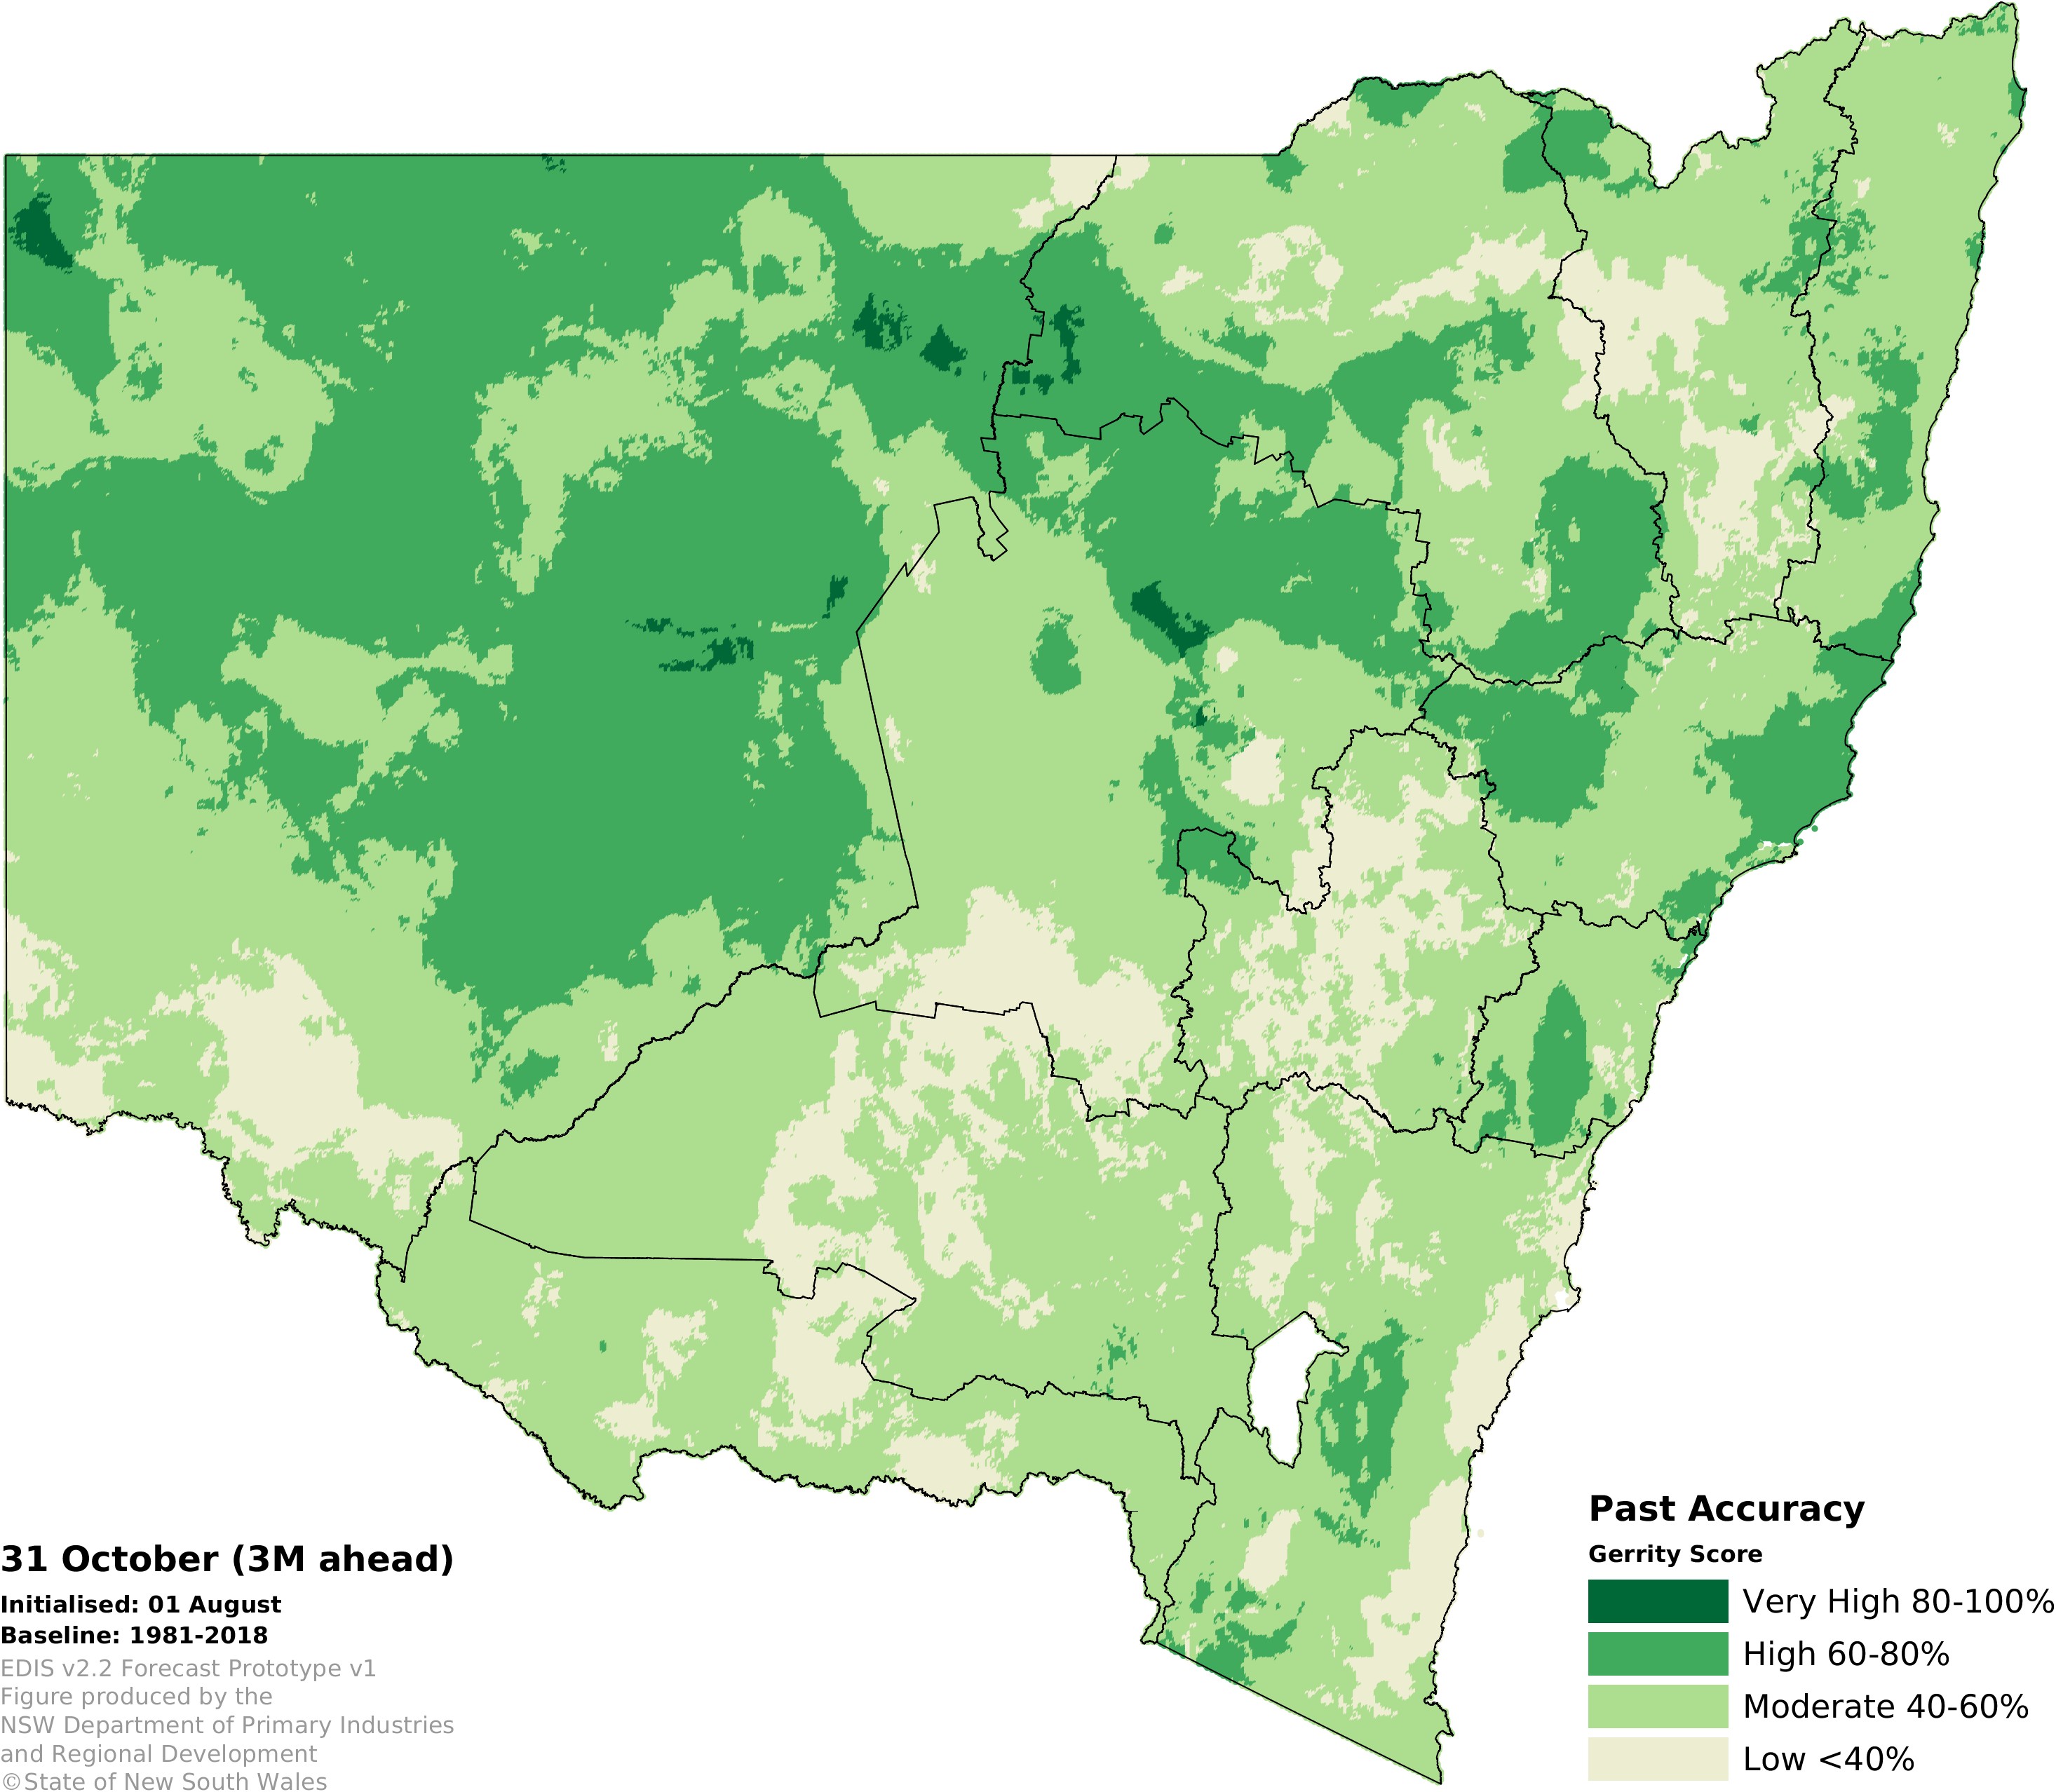
Past accuracy refers to how closely previous forecasts matched the actual CDI categories that occurred, allowing an assessment of the reliability of the current forecast. If the model has consistently provided accurate predictions, there is more confidence in its current output. However, if past accuracy has been variable, it might suggest a need for more caution in interpreting the forecast, especially when ensemble agreement is low.